
If you want to create a great user experience, it is essential that you understand how users interact with your product. UX analysis is about examining data collected from users to uncover insights that can lead to a better user experience.
This process identifies what works well and what needs improvement in a product. By focusing on user behavior, you can make informed decisions that result in better products and happier customers.
UX data gives you a deep understanding of how happy users are when they use your product. By analyzing this data, you can pinpoint areas that frustrate them and discover opportunities for improvement.
At the end of this article, you will gain a clear understanding of:
- What UX research data is and why it’s crucial for product development.
- The various types of UX research data and how to maintain a balanced approach to maximize insights about your users.
- The methods for collecting and analyzing this UX data.
- How to interpret the findings.
- And finally, how to effectively communicate your insights to stakeholder.
Let’s get started.
Understanding UX Research Data

Before getting into UX analysis, it’s important to understand what we’re discussing.
UX stands for User Experience, which refers to the overall experience that a user has while using a product or service.
Data analysis is the process of examining all the data generated by users as they interact with a product or service. In the case of online products, it includes where they click, how much time they spend on a page, where their eyes travel across the page, what information they’re looking for, and whether they find it.
Typically, UX analysts study this data to draw conclusions. They ask questions like: Is the product helping users achieve their goals? Are users performing the actions we want them to on the product? The answers lie in the data.
The Role of UX Research in Data Collection
How can you go about gathering the necessary data? UX research plays a pivotal role. This research involves various methods, such as usability testing, surveys, and using analytical tools. The data collected through UX research forms the foundation for UX analysis.
UX research helps in understanding not only what users are doing but also why they are doing it. This deeper understanding is crucial for making the right design and product development decisions.
How to Integrate UX Research with UX Analysis
Integrating UX research with UX analysis ensures that the data you collect is relevant and actionable. This integration involves a continuous cycle of research, data collection, analysis, interpretation, and iteration.
A successful integration of UX research and UX analysis requires a clear understanding of the goals of both processes.
You should conduct UX research to answer specific questions about the behavior of your users, while UX analysis should focus on interpreting the data to give you actionable insights.
This collaborative approach ensures that the data collected is not only useful but also aligned with the objectives of the company.
Let’s go over the types of UX data you can collect to improve your user experience.
Types of UX Data: Quantitative vs. Qualitative

Quantitative data refers to numerical data that can be measured, while qualitative data is more descriptive. Let’s define them further:
- Quantitative Data: This includes metrics like “Task Completion Rates,” measured in percentages, and “Time On Task,” measured in seconds or minutes. Quantitative UX data provides concrete evidence of how users interact with a product.
- Qualitative Data: This data is descriptive and captures the “why” behind users’ behaviors. It offers a deeper understanding of the user experience. For example, for an e-commerce business, quantitative data might show how many users complete a purchase, while qualitative data might reveal why some users abandon their shopping cart.
The Value of Quantitative Data in UX Analysis
Quantitative UX data is invaluable because it helps you understand the measurable aspects of your user experience.
Metrics like Task Completion Rates and Time On Task provide clear indicators of how well a product is performing.
By analyzing these metrics, you can identify specific areas that need improvement, such as simplifying navigation or reducing the time it takes for users to find what they need.
Quantitative data also allows for benchmarking and comparison. By tracking these metrics over time, you can measure the impact of changes to the product and see how your user experience compares to industry standards.
This data-driven approach ensures that decisions are based on objective evidence rather than assumptions.
The Importance of Qualitative Data in UX Research
While quantitative UX data provides the “what,” qualitative data provides the “why.”
This type of data is crucial for understanding the underlying reasons behind user behavior. Through methods like interviews, focus groups, and open-ended survey questions, UX researchers can uncover insights into the motivations of users, but also their frustrations.
Qualitative data is particularly valuable when trying to improve the emotional and psychological aspects of the user experience. For example, understanding why users feel frustrated with a particular feature can lead to a more empathetic product design.
Balancing Quantitative and Qualitative Data in UX Analysis
To have a balanced approach to UX analysis, consider combining both quantitative and qualitative data. This combination provides a more complete view of the user experience and will help you understand both the measurable outcomes and the reasons behind them.
For example, if quantitative data shows a high drop-off rate at a specific point in the user journey, qualitative data can help explain why users are leaving.
By analyzing these two types of UX data together, you can identify the root cause of the issue and develop targeted solutions to improve the user experience.
Let’s see how you can collect these different types of UX data.
Common Sources of UX Data
UX data can be collected from various sources, including:
- Usability testing: Observing users as they interact with a product.
- Surveys: Asking users specific questions about a product and gathering their feedback.
- Analytics tools: Softwares like Google Analytics generate data on user behaviors on a webpage or product.
- Customer feedback: Collecting insights from reviews and direct feedback.
You can use several of these UX data collection techniques. For instance, you might conduct usability tests to observe users navigating your website, and then use surveys to gather feedback on their experience.
Let’s cover each of these.
Using Usability Testing for In-Depth UX Analysis
Usability testing is a powerful method for collecting UX data because it involves observing real users as they interact with a product.
This method provides first hand insights into what challenges users encounter, and where they succeed. There are different types of usability testing, including moderated and unmoderated sessions (more on that later).
In moderated sessions, a moderator (usually a UX researcher) guides the user through tasks and observes their behavior in real-time.
In unmoderated sessions, users complete tasks independently, with their interactions recorded for later analysis.
Both methods provide valuable UX data that can be used to improve the user experience.
Using Surveys to Collect UX Data
Surveys are another effective method for gathering UX data. They allow you to reach a large number of users and collect feedback on specific aspects of a product.
Surveys can be used to gather both quantitative and qualitative data, making them a versatile tool for UX research.
When designing surveys, it’s important to ask clear, concise questions that will elicit useful responses. Open-ended questions can provide rich qualitative insights, while closed-ended questions can generate quantitative data.
The Role of Analytics Tools in UX Analysis
Analytics tools like Google Analytics are essential for collecting quantitative UX data. They track user behavior on a website or app, and provide you with metrics such as Page Views, Click-Through Rate, Time Spent On Page, and Conversion Rate.
This data helps you understand how users interact with your product and identify areas where the user experience can be improved.
For example, if analytics data shows that users are spending a lot of time on a particular page but not taking the desired action, this could indicate a problem with the page’s design or content.
By analyzing this UX data, you can make decisions backed by evidence rather than assumptions.
The Value of Customer Feedback in UX Research
Customer feedback is a valuable source of UX data because it comes directly from the users themselves.
Whether it’s through reviews, support tickets, or direct communication, customer feedback provides you with insights into how users perceive your product and what issues they encounter. This qualitative data is crucial for understanding the emotional and psychological aspects of the user experience.
By analyzing customer feedback, you can identify recurring themes and trends that indicate areas for improvement.
Key Concepts in UX Analysis

Before you start collecting UX data, it is important that you understand some of the key concepts in UX analysis. They will help you interpret it effectively. Some of the most important include:
- User personas: Representations of your target users based on demographics, behaviors, needs, and pain points. They provide the context needed to interpret the UX data you gather. Note that, in some cases, the insights derived from your UX research can help you draw out a persona within your audience further down the line. User personas aren’t necessarily established at the beginning of the research process.
- User journeys: The steps that users take to achieve a goal within your product. These journeys shed the light on pain points that users encounter as well as areas for improvement.
For example, in an e-commerce context, you might create a persona of a typical shopper and map their journey from browsing to purchasing, identifying where they might encounter issues.
Let’s dive deeper into each one of these.
The Role of User Personas in UX Analysis
User personas are fictional representations of your target users. They are created based on real data from UX research and represent the key demographics, behaviors, pain points, and needs of your users.
They provide a human face to the data, making it easier to interpret UX data and make informed decisions about the user experience.
By using user personas in UX analysis, you can better understand how different types of users interact with your product.
Mapping User Journeys for Better UX Analysis
User journeys represent the steps users take to achieve a goal within your product. By mapping out these journeys, you can see where they drop off or succeed.
For example, in an e-commerce business, a user journey might start with searching for a product, continue with adding the product to the cart, and end with completing the purchase. By analyzing the data associated with each step of this journey, you can identify where users face challenges and make data-driven decisions to optimize the user experience.
How User Journeys and Personas Interact in UX Analysis
By combining user personas and user journeys, you can get a more complete view of the user experience. User personas give context to the data by representing the target users, while user journeys map out the steps these users take within the product. Together, they provide a framework for interpreting UX data and making the best decisions about product design and development.
For example, by understanding that a particular user persona struggles with the checkout process, you can focus your UX analysis on that part of the user journey. This targeted approach enables you to make improvements where they will have the most impact on the overall user experience.
Now that you understand the foundational concepts of UX analysis, let’s go over the ways you can start collecting data.
Preparing Your Data for Analysis
UX Data Collection Methods
Collecting data is the first step in drawing conclusions from it. To do so, you can employ several methods:
- Moderated testing: Conduct sessions with users to observe how they interact with the product. The feedback gathered is qualitative, even though certain findings can be supported by quantitative data.
- Unmoderated testing: It allows users to interact with a product independently. Data from these interactions is collected through automated tools.
- Surveys and polls: These are structured questions posed to a large number of users to gather both quantitative and qualitative data.
For instance, you could run a moderated test where users attempt to find a product on your e-commerce site, or send out surveys asking how easy it was to find what they were looking for.
Ensuring Your UX Data Is Reliable
Once you’ve decided on the methods for gathering data and the type of data you want, ensuring consistency should be your next priority. Using the same methods and tools across research sessions and user groups is crucial.
For example, if you’re collecting UX data through surveys, use the same questions and formats each time. If you’re conducting usability tests, use the same set of tasks and instructions for each participant. This consistency ensures that the UX data you collect is reliable.
Regularly reviewing the data is also important. Check for errors and anomalies. If answers differ significantly from one session to another, there might be an issue with your sample, the way you ask questions, or the instructions given to users. If they get stuck, it might not be solely because of the website’s usability, but rather due to how you’re instructing them to complete tasks.
Cleaning and Organizing Your UX Data
Once you have collected UX data, it might be necessary to clean and organize it in order to make the analysis smoother. Well-organized data makes it easier to identify patterns and trends.
Here are some best practices:
- Remove outliers: Exclude data points that are significantly different from the rest. For instance, if some users sent you incomplete survey responses, remove them to ensure accuracy in your UX analysis.
- Categorize data: Group data into relevant categories. Use folders and subfolders based on different aspects of the user experience. For example, you might have separate folders for usability test results, survey responses, etc.
- Label and tag: Assign labels to your data points to make it easier to organize and retrieve when necessary. For example, you might label usability test files by date and participant ID.
- Document your process: Keep a record of how your UX data is organized, including the rationale behind your categorization and labeling choices. This documentation will be helpful if you need to revisit the data or if others need to access it.
Tools and Software for UX Analysis
Several robust tools can turn complex data into digestible information. If you would like to use one of them, here are some popular options:
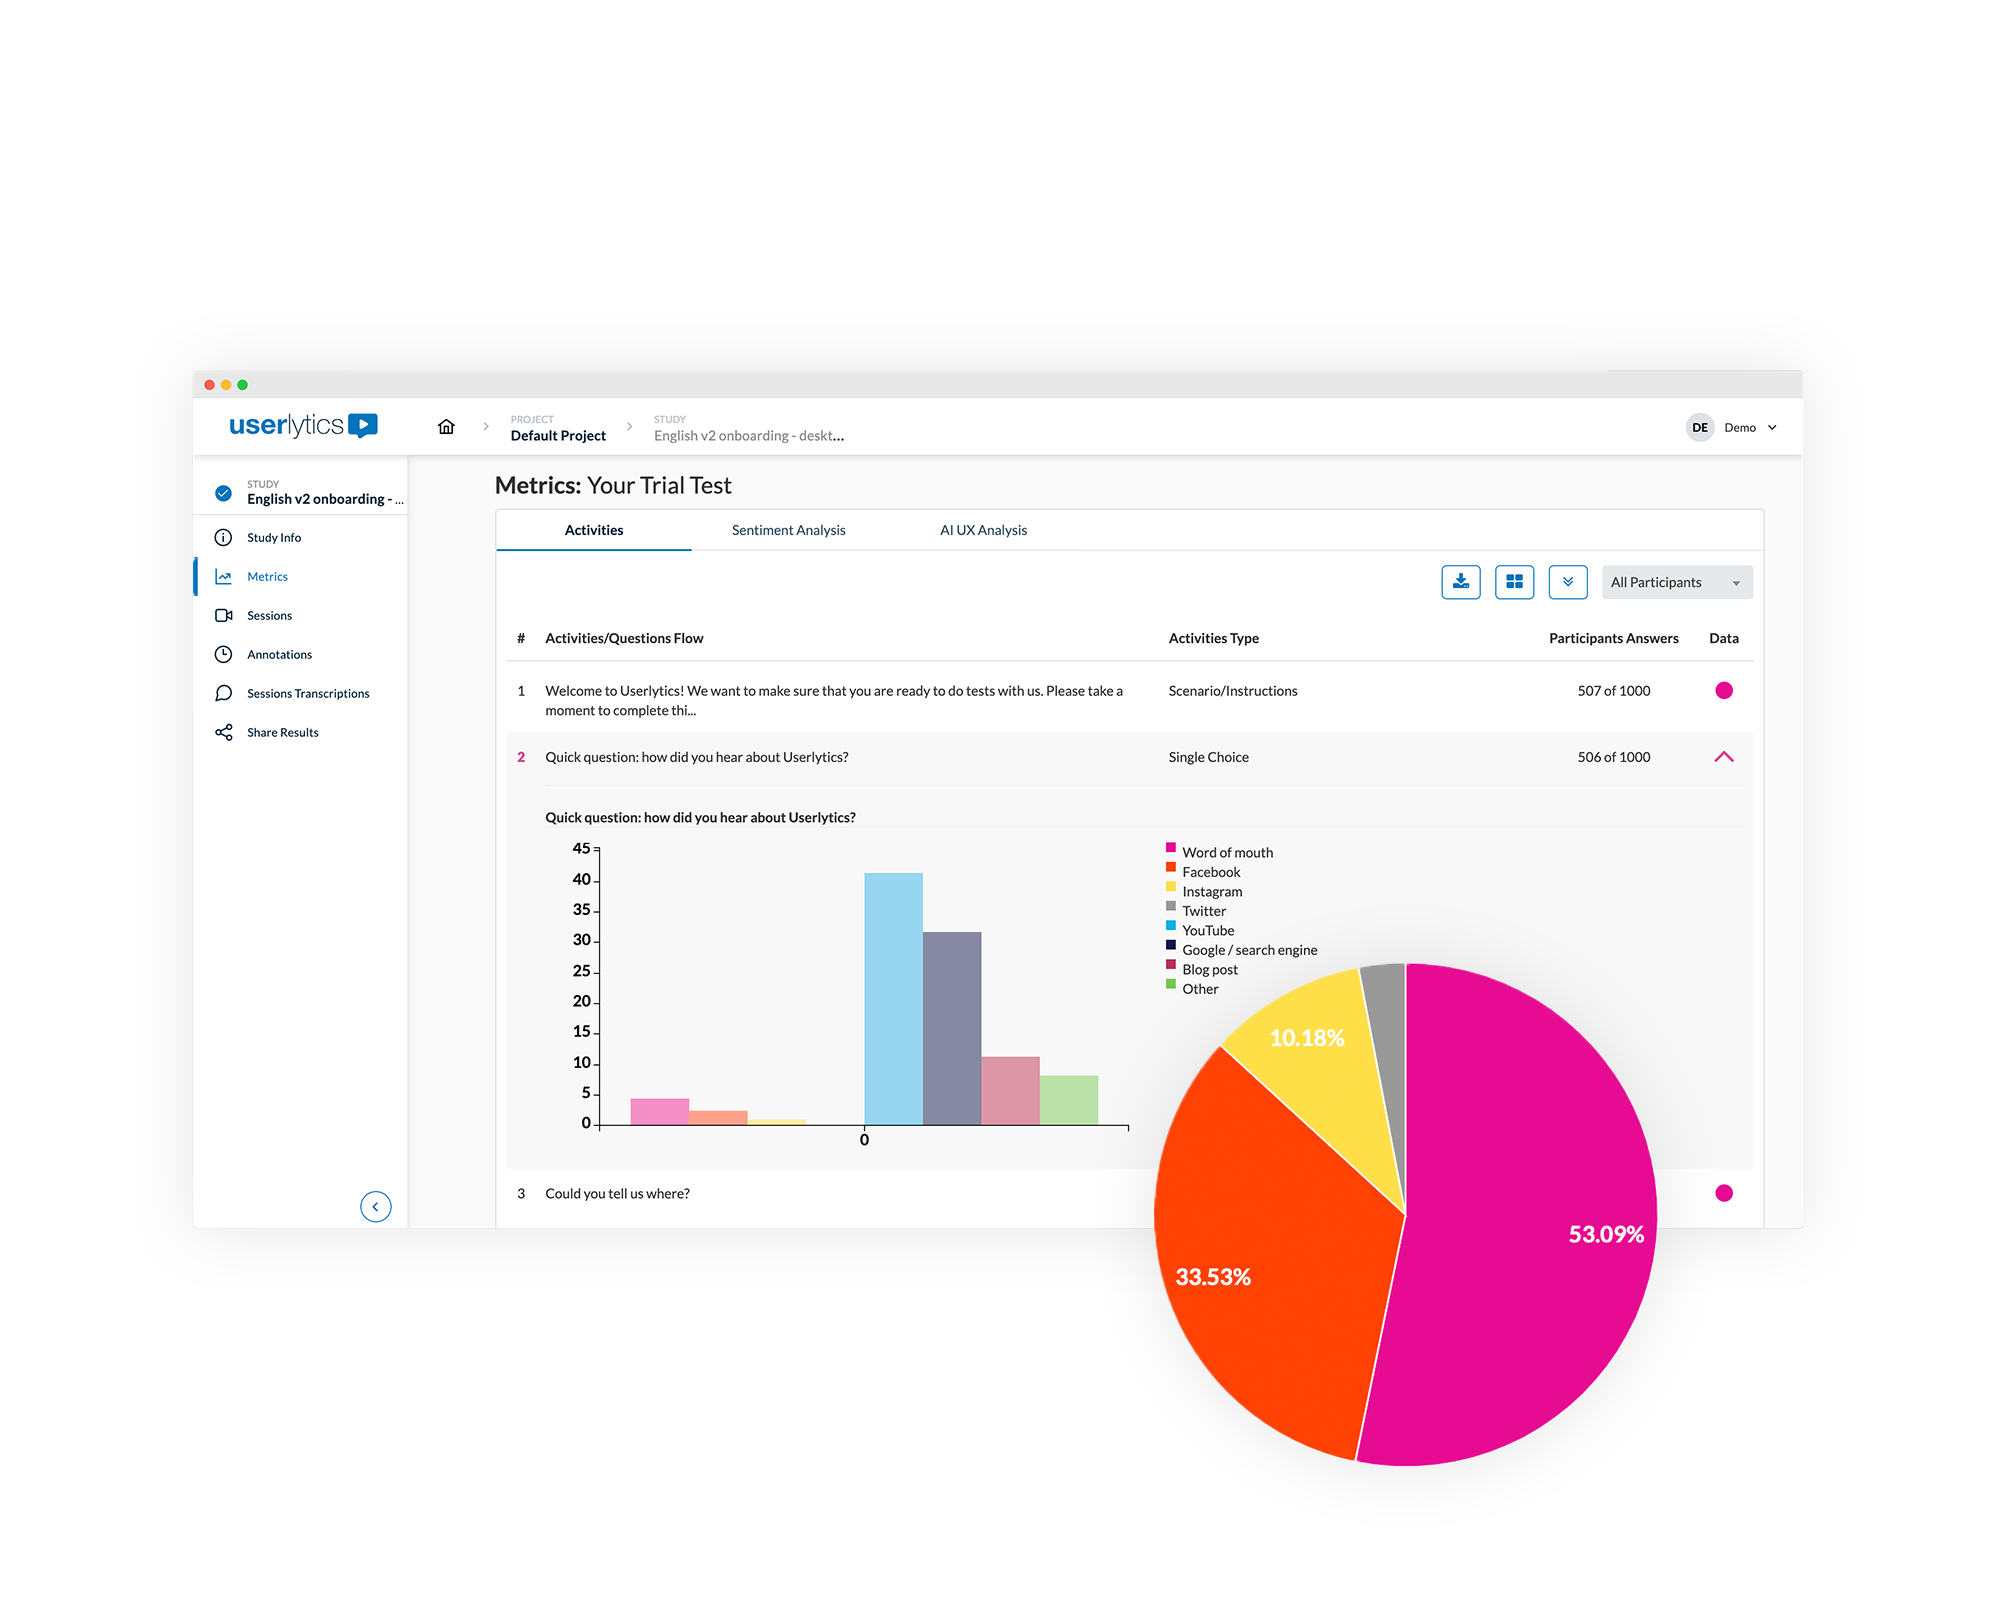
- Userlytics: Userlytics is a leading platform for remote UX research and usability testing, offering features like Sentiment Analysis and First-Click Testing to make data more understandable. It comes with its proprietary panel of more than 2 million participants. Another popular alternative is UserTesting.
- Google Analytics: It tracks website traffic, user behavior, conversion rates, and more. It’s widely used by both small and large companies, although it is mostly limited to quantitative data.
- Hotjar: Excellent for generating heatmaps and session recordings, showing where and how users interact with your product.
How to Choose the Right UX Tool
When selecting a UX analysis tool, consider factors such as:
- Budget: Ensure the tool aligns with your budget constraints.
- Features and project requirements: Identify the specific features needed for your analysis. Do you require moderated testing? Should it be qualitative or quantitative? Answering these questions will help in making the right choice.
Small businesses might start with free or low-cost tools like Google Analytics before investing in more advanced solutions. Large companies with bigger UX research budgets may benefit more from comprehensive platforms such as Userlytics.
If you’re interested in investing in a comprehensive UX research and testing tool, check out our guide on the 6 best UX testing tools of 2024.
Analyzing Quantitative UX Data
Key Metrics to Track
Quantitative UX research can generate a variety of insights. Some common metrics include Task Success Rate, Time on Task, and Error Rates.
Task Success Rate
Task Success Rate measures the percentage of users who successfully complete a specific task. For example, on an e-commerce site, a high success rate might indicate that users find it easy to complete a purchase.
How to Calculate the Task Success Rate: (Number of Successful Tasks / Total Task Attempts) x 100.
Time on Task
Time on Task measures the average time users take to complete a task. This metric can highlight where users struggle. For example, if users take a long time to complete a purchase, the checkout process might be too complex.
How to Calculate Time on Task: Total Search Time / Number of Searches.
Error Rates
Error Rates track the number of errors users make while using a product. High error rates suggest usability issues. For example, if users frequently enter incorrect information during checkout, it might indicate a need to simplify input fields or provide clearer instructions.
How to Calculate the Error Rate: (Total Number of Misinterpretations / Total Number of Attempts) x 100.
Analyzing Qualitative UX Data
Analyzing qualitative data can be more challenging than quantitative data analysis because each user’s feedback is unique. However, you can use techniques like Thematic Analysis to make the process smoother.
Thematic Analysis
Thematic Analysis identifies patterns and themes within your qualitative UX data. Those patterns can be categorized into groups to facilitate the analysis.
Here are the steps you can take to perform Thematic Analysis on your qualitative UX data:
- Familiarization: Review the UX data enough times to become familiar with its content.
- Labeling or coding: Once you’ve familiarized yourself with the data, assign labels or codes to segments based on their theme.
- Identify themes: Group these labels into broader themes representing common patterns.
To illustrate the above, you might code interview responses from users giving their feedback about their checkout experience, identifying themes like “confusing interface” or “missing payment options.”
Interpreting UX Data
Identifying Patterns and Trends
After collecting and categorizing data, the next step is interpreting it. This means identifying patterns and trends that will help you understand the overall user experience.
To interpret your data effectively, here are some foundational steps you can follow:
- Aggregate your data: If you collected UX data from several sources, combine them to get a comprehensive understanding.
- Recognize patterns: Identify recurring themes and behaviors. For example, you might notice that users tend to abandon their carts after filling them up in the first place. Why?
- Analyze trends: Monitor changes in user behavior over time to identify trends and potential areas for improvement. To follow-up on our previous example, you might notice that visitors abandon their carts specifically after seeing your shipping costs. This could suggest the need for more transparent pricing.
Drawing Insights from UX Analysis and Avoiding Common Mistakes
The next step is to turn the raw UX data you’ve gathered into practical recommendations. Start by pinpointing areas where improvements can enhance the user experience. You may come up with various ideas, such as reducing the steps in the checkout process or being more transparent about delivery costs. But which one should come first?
Deciding which changes will have the most impact can be tricky. By suggesting solutions and discussing them with your team, you can make a well-rounded decision.
It’s important to share your findings and recommendations with your team because they can help challenge any preconceived notions you might have. Confirmation bias is a common trap in UX research and design, and interpreting data to fit your assumptions can lead you in the wrong direction.
Be careful when applying your findings to a larger audience without solid proof. If your UX research was done with a small group, it may not be accurate to generalize the results. Make sure your conclusions are based on solid data and apply to all your users. For example, you can use a sample size calculator to find the right sample size that represents your audience.
Communicating Your Findings

In order to communicate your findings and recommendations to your team, you must ensure that your reports are structured and easy to understand.
Let’s explore some strategies to make sure your reports gain maximum buy-in from stakeholders.
Creating Effective Reports
The insights from UX research can be abundant, diverse, and sometimes quite complex. To communicate them effectively, you can use the following strategies:
- A clear structure: Organize your information logically by creating sections for key findings and recommendations. Earlier, we discussed labeling and categorizing your insights. Use these labels to structure your report, linking key findings like “Confusing checkout process” to the relevant UX data.
- Make it visual: Most people don’t enjoy reading through numbers. The more visually intuitive your report is, the more impactful it will be.
- Make it actionable: Offer solutions to your findings. Your report should go beyond just presenting the data; it should also include recommendations to address the issues and help improve the product.
A well-structured report helps stakeholders grasp the findings and make informed decisions. Beyond the recommendations mentioned earlier, one of the most powerful ways to communicate your findings is by crafting a compelling and engaging narrative. Connecting the data to the user experience through storytelling ensures that your team and stakeholders fully understand your recommendations.
Here are some of the best strategies to make your data more compelling:
- Use a persona: Step into the shoes of your target audience and guide your audience through the ideal user journey. Utilize this fictional persona throughout the report to illustrate each of your key points.
- Use real examples: Include real-life examples, supported by quotes or video snippets, to highlight the stages your persona experiences. These examples can reinforce your findings and make them more relatable.
- Illustrate your recommendations with an improved user journey: Show the potential impact of your recommendations on the user experience and the company’s business goals. Revisit the stages your fictional persona goes through and demonstrate how their experience would improve with the implementation of your recommendations.
Iterate And Improve Continuously
What happens after you’ve presented your points to your team and stakeholders? Don’t let your report gather dust!
UX analysis should be an ongoing process. Keep revisiting your data and findings regularly. You might be surprised at how many new insights and improvement ideas you can uncover by continuous discovery.
Conclusion
Understanding how users interact with your product is key to creating a great user experience. UX analysis helps you uncover important insights about the behavior of your users, their preferences, but also their frustrations. By analyzing both quantitative and qualitative data, you can make decisions that directly improve their experience.
When you combine UX research with data analysis, you gain a deeper understanding of your users. Whether you’re using usability tests, surveys, or any type of analytical tools, the insights you gather will guide your design and development processes.
By regularly collecting and analyzing UX data, you stay ahead of potential issues and find opportunities for improvement. This approach leads to happier users and, subsequently, a stronger brand reputation.
In short, UX analysis is about connecting with your users, understanding their needs, and creating a product that truly resonates with them. By focusing on this data-driven approach, you can build products that delight users and help your business thrive.
Consider using Userlytics for all your UX research needs – from conducting usability testing to analyzing its results. Our comprehensive suite of tools can help you take your user experience from good to truly great. Reach out to us.
Userlytics

Since 2009 we have been helping enterprises, governmental organizations, non-profits, agencies and startups optimize their user experience, or UX. With our state-of-the-art platform, massive global participant panel and unlimited accounts/seats for democratizing user research, we are the best all-in-one solution for remote user testing.
Schedule a Free DemoEl Taghdouini, M. September 5, 2024. UX Analysis: How To Collect And Analyze UX Data . Userlytics.